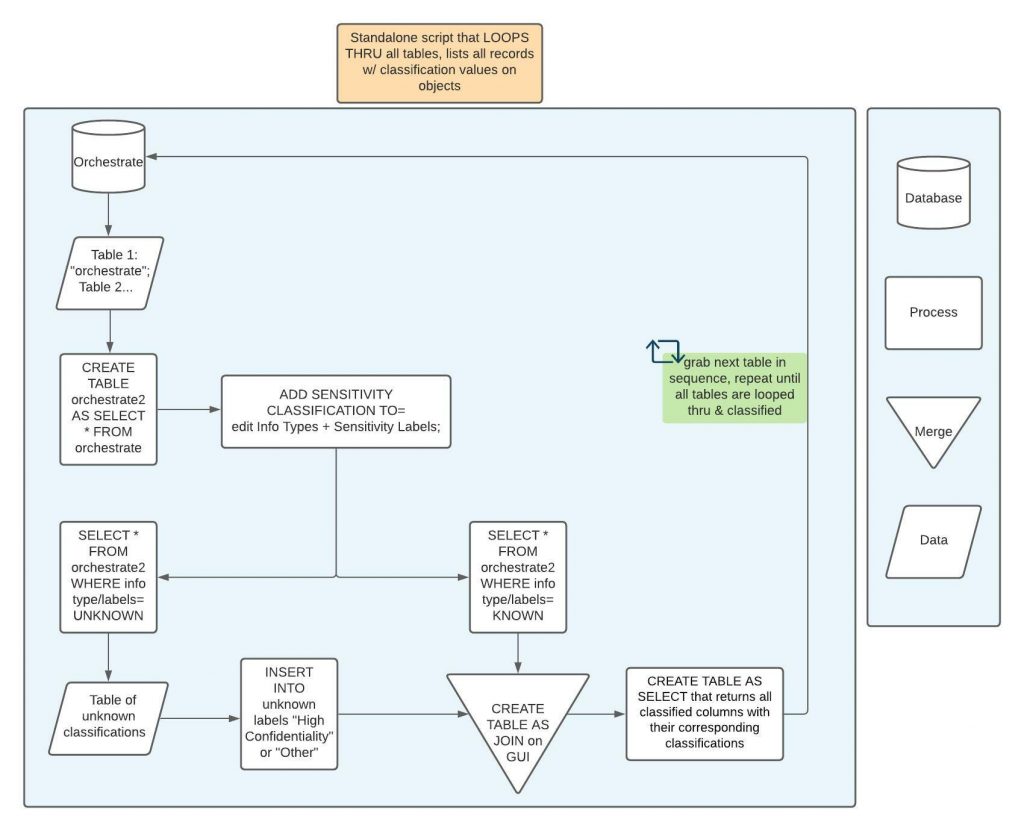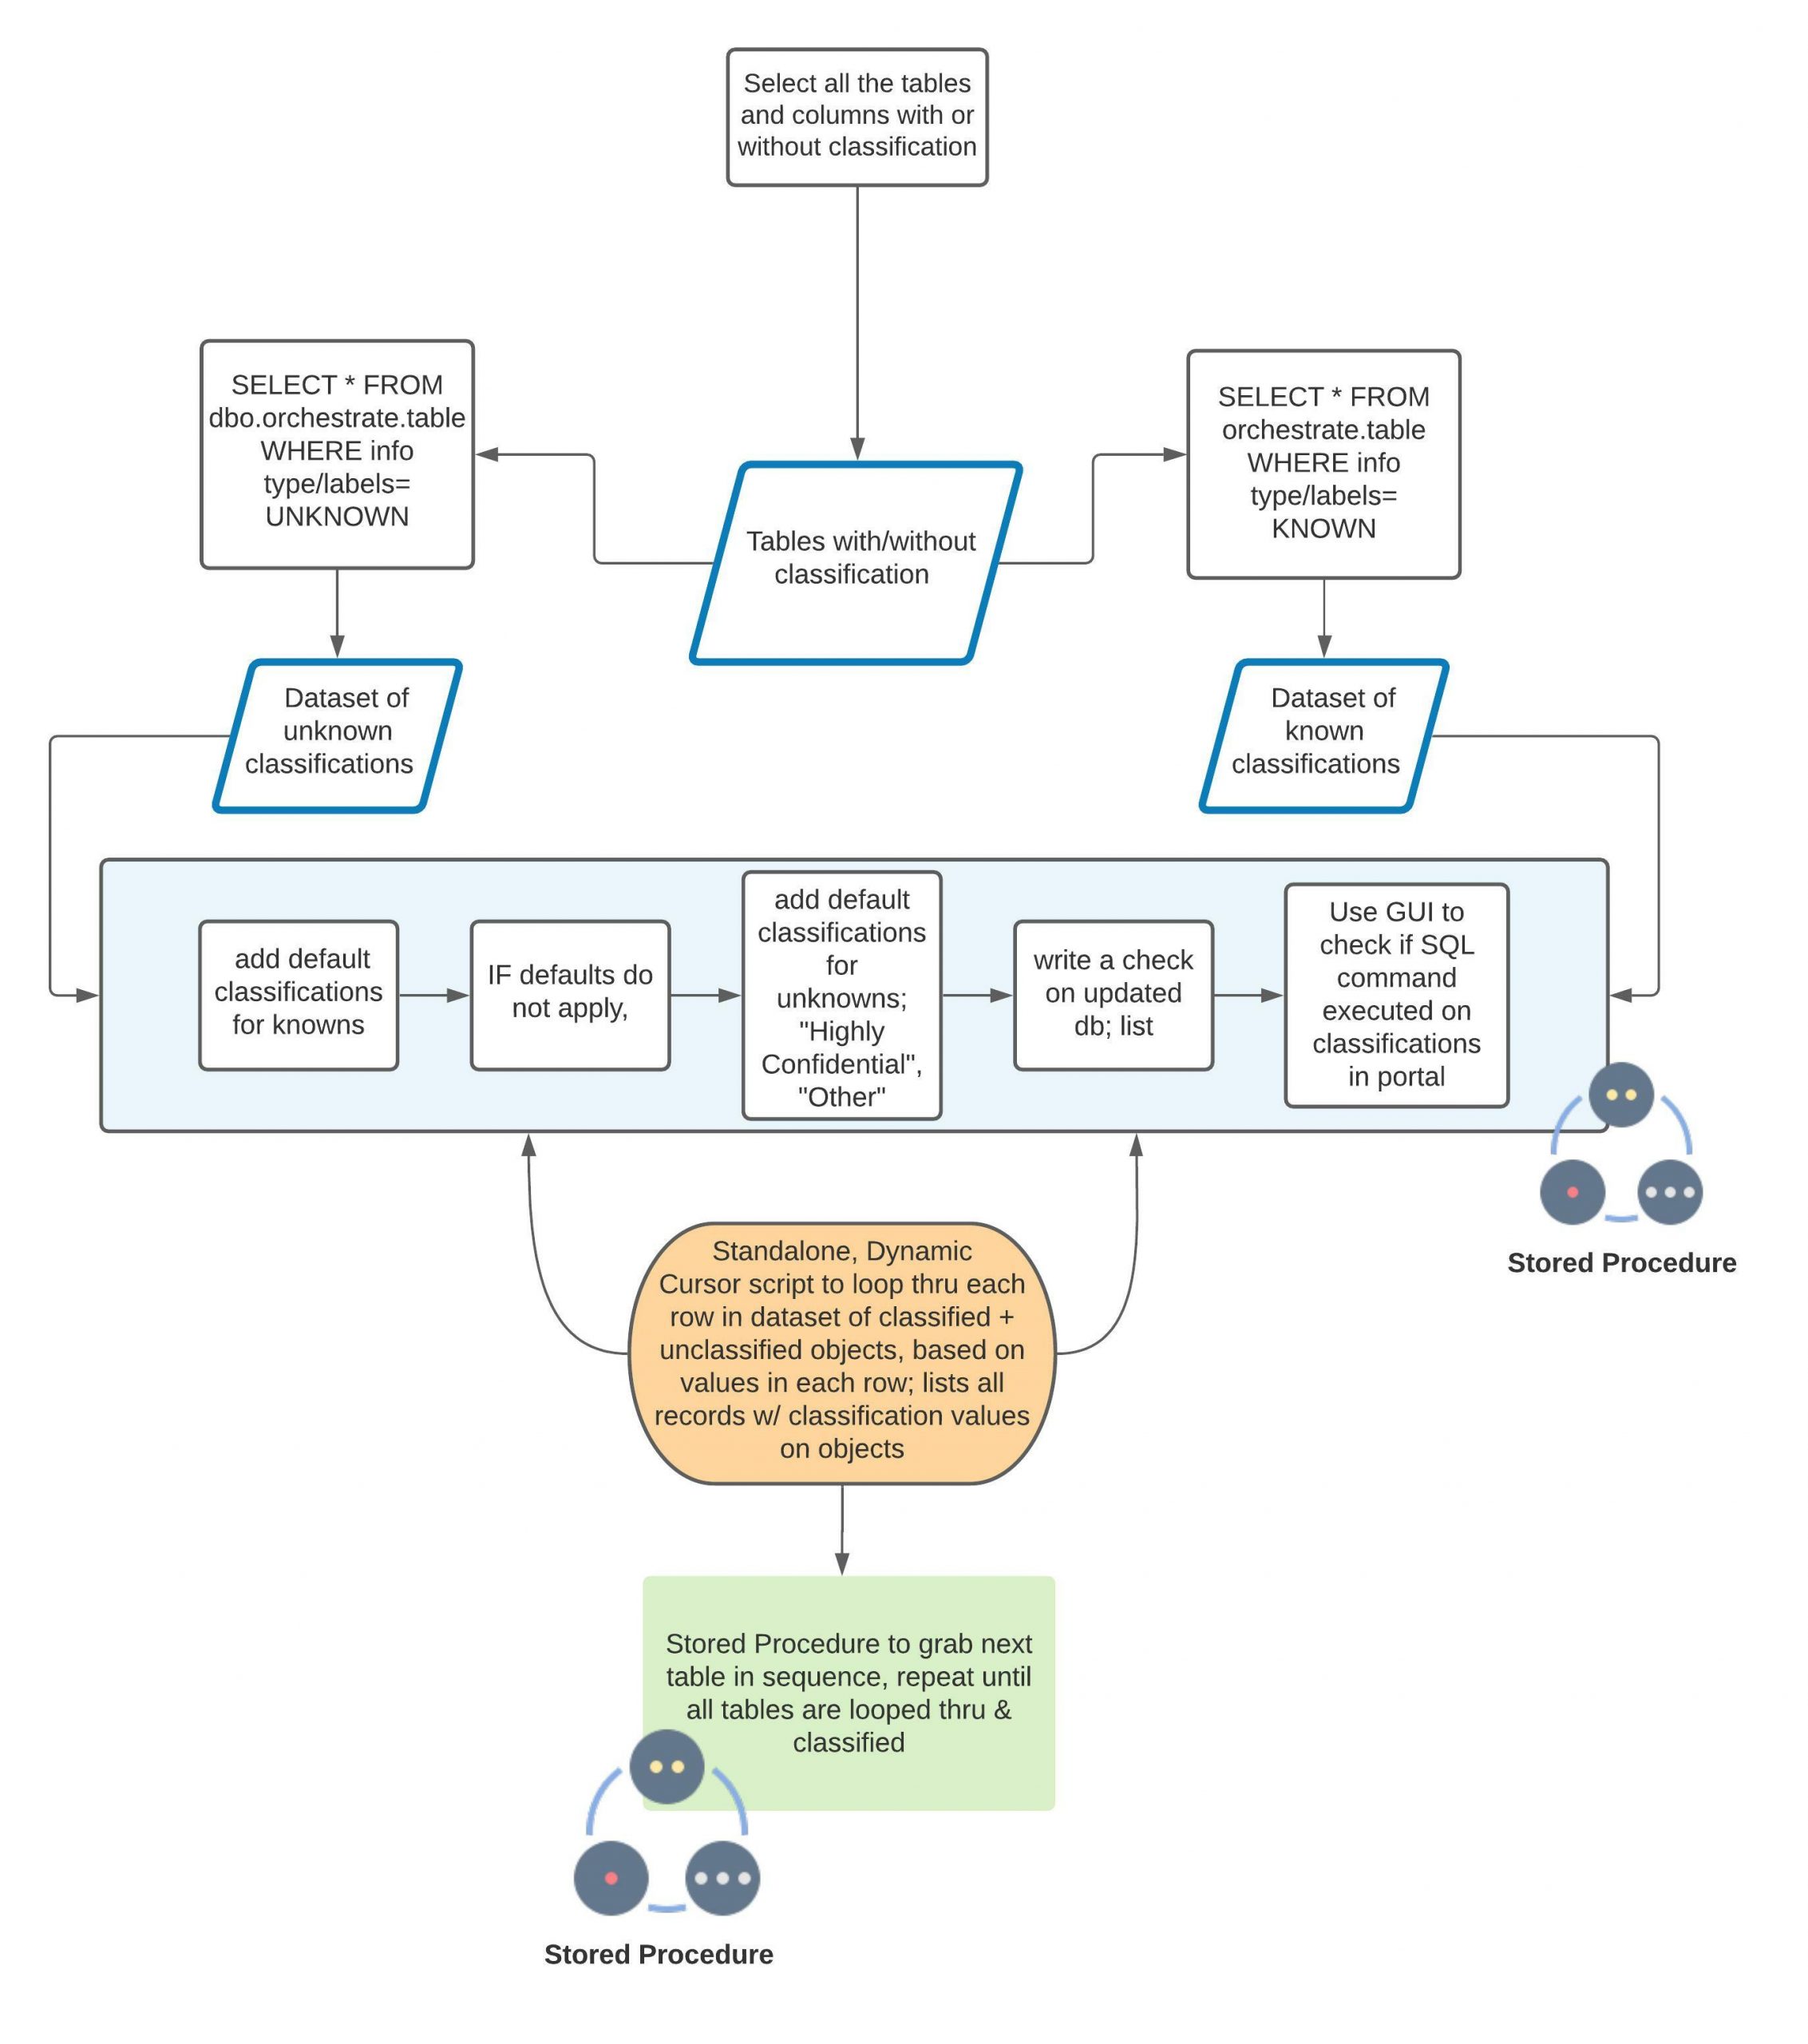
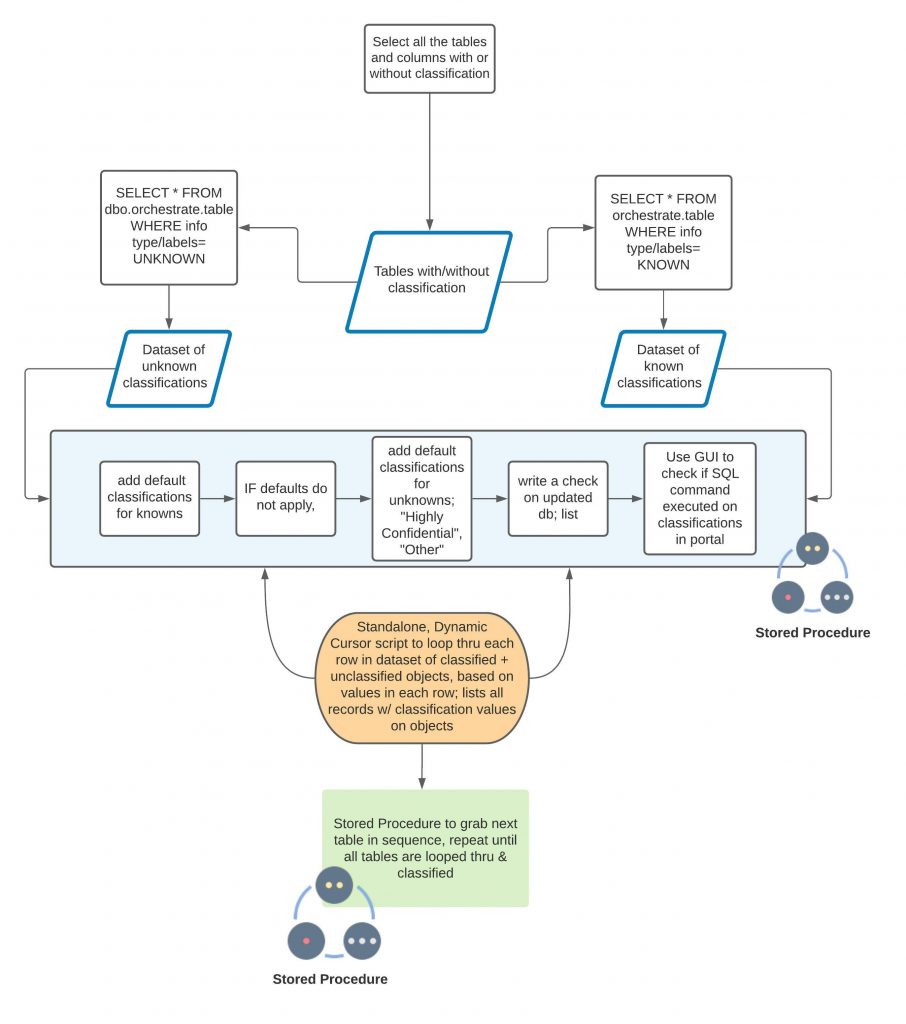
These algorithm diagrams illustrate the same process; however, they use 2 different ways to visualize the steps in the data classification process, and how it fits into the overall mission of the task.
Ask:
1) CTO needs to visualize a data classification process that has already been written into SQL code
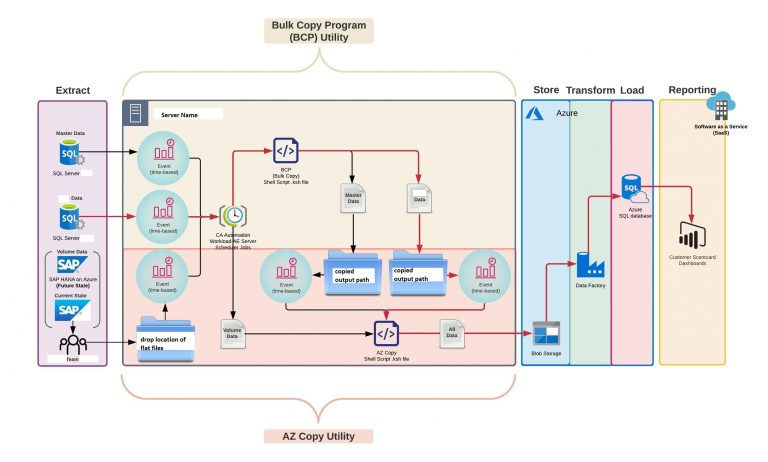
2) In addition, they want to add an automated element to their process, using a Python script for batch data processing.
These diagrams are a quick sketch of what that process would look like; when the process gets built into the production environment, they are an example of documentation that gets saved to the solution’s document repository. These are also good examples of something that can be used in a technical memo, if you need to send quick but clear communication.
Taking it a step further…
Simply write out the steps shown here, pop them into chatgpt requesting a Python code output, and you have pretty quickly generated production-level code in a fraction (1/10th) of the time it would normally take (before we had chatgpt, back when we had to either write it out manually or peruse Stack Overflow for hours).
Use that .py as an automated Glue job in AWS or as an automated Azure Function.
Boom, done. That’s the power of a big data smart solution engine, that can save money and generate new value (among other functions).
Date of Creation: ~ December 2021