Skip to content
Home
Services
Portfolio
Data Blog
Contact Us
Dynamic Data Labs
Home
Services
Portfolio
Data Blog
About Us
Contact Us
Who We Are
Dynamic Data Labs
Menu
Past Projects
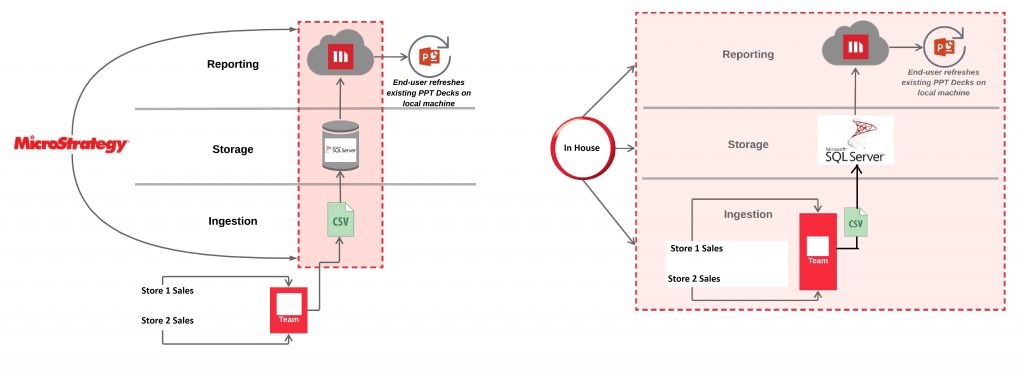
Microservices: Database Optimization & Migration
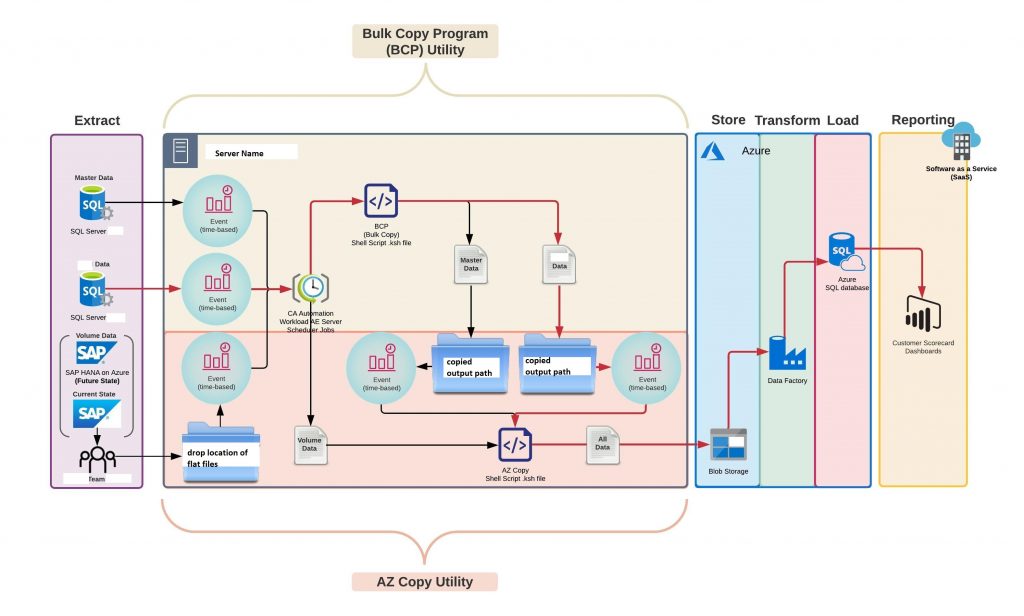
Enterprise-Level Data Engineering
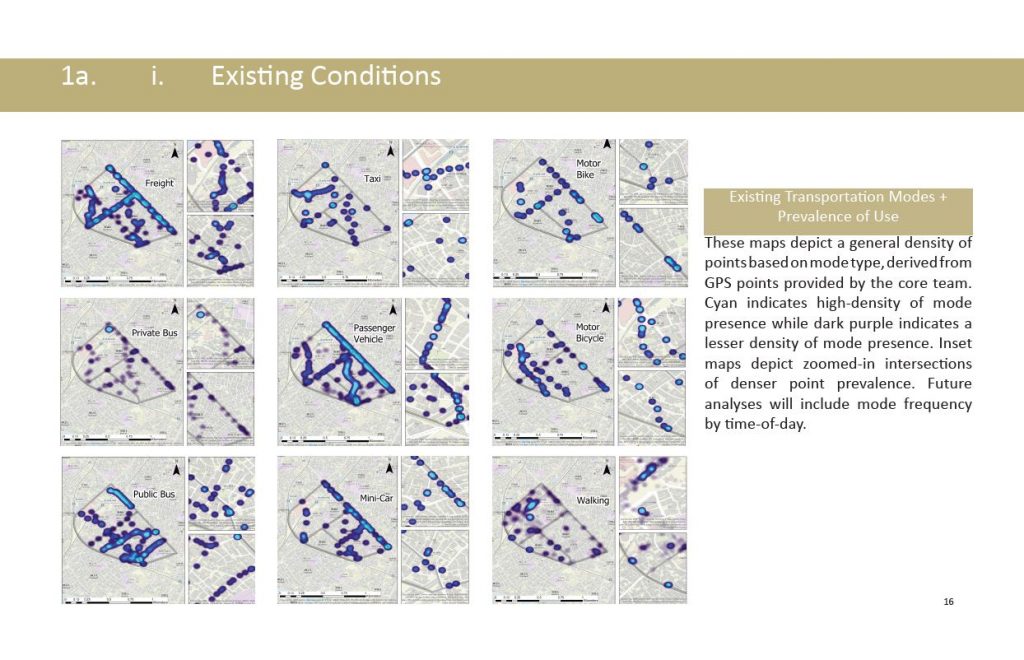
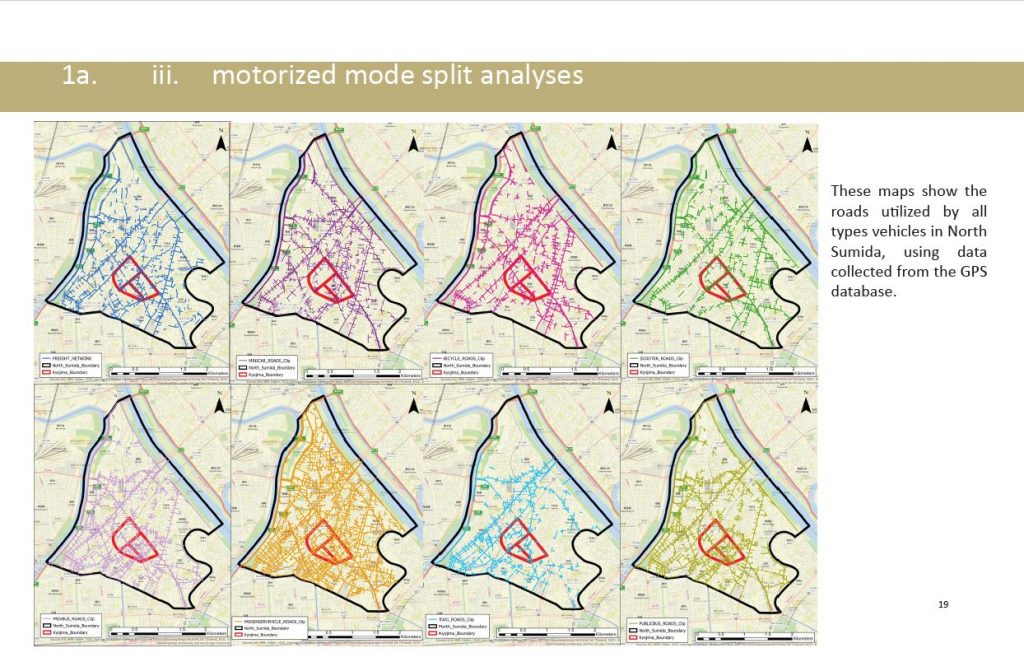
Transportation Network Analysis + Hazard Prevention
Site Selection based on Human Behavior Analysis
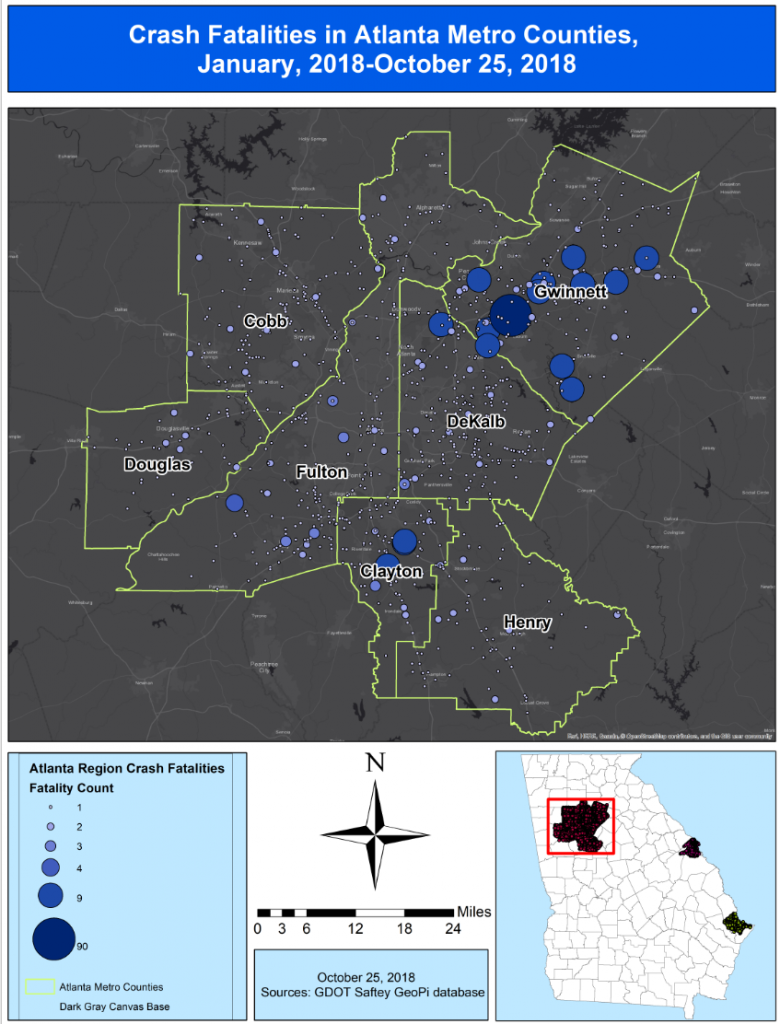
State of Georgia Car Crash Database
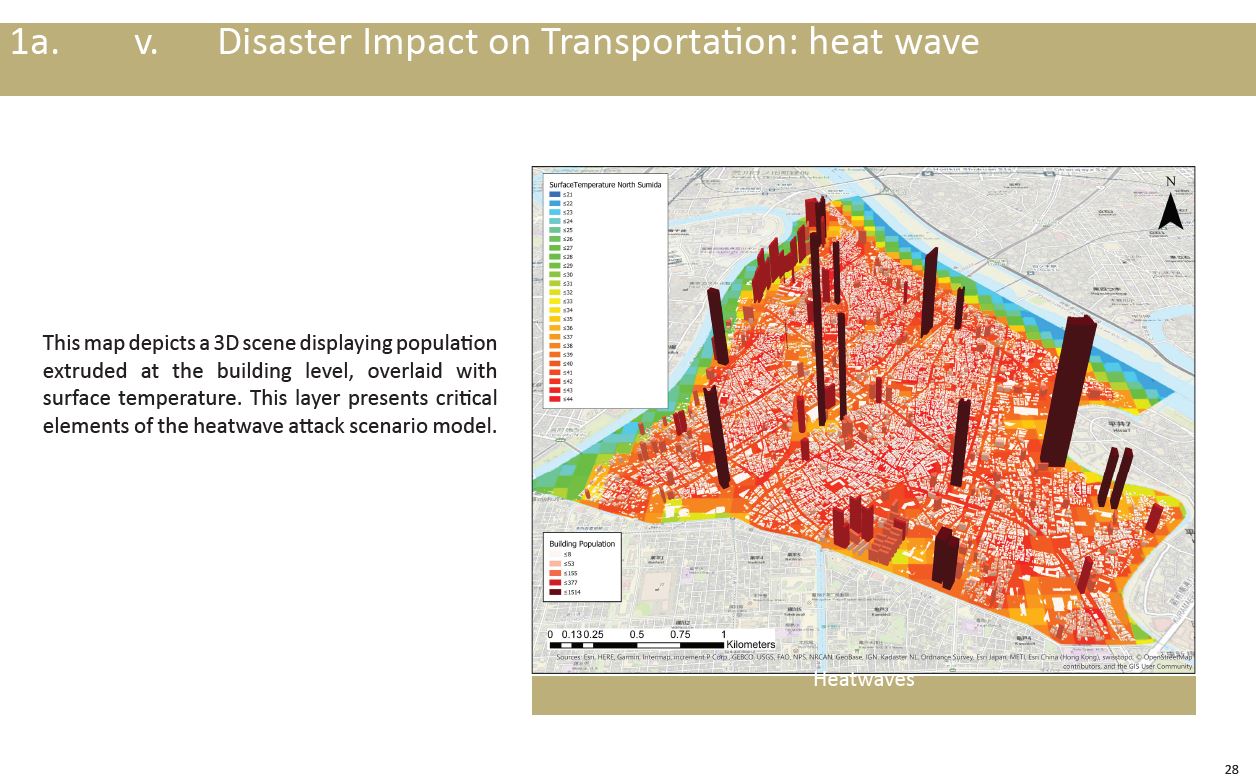
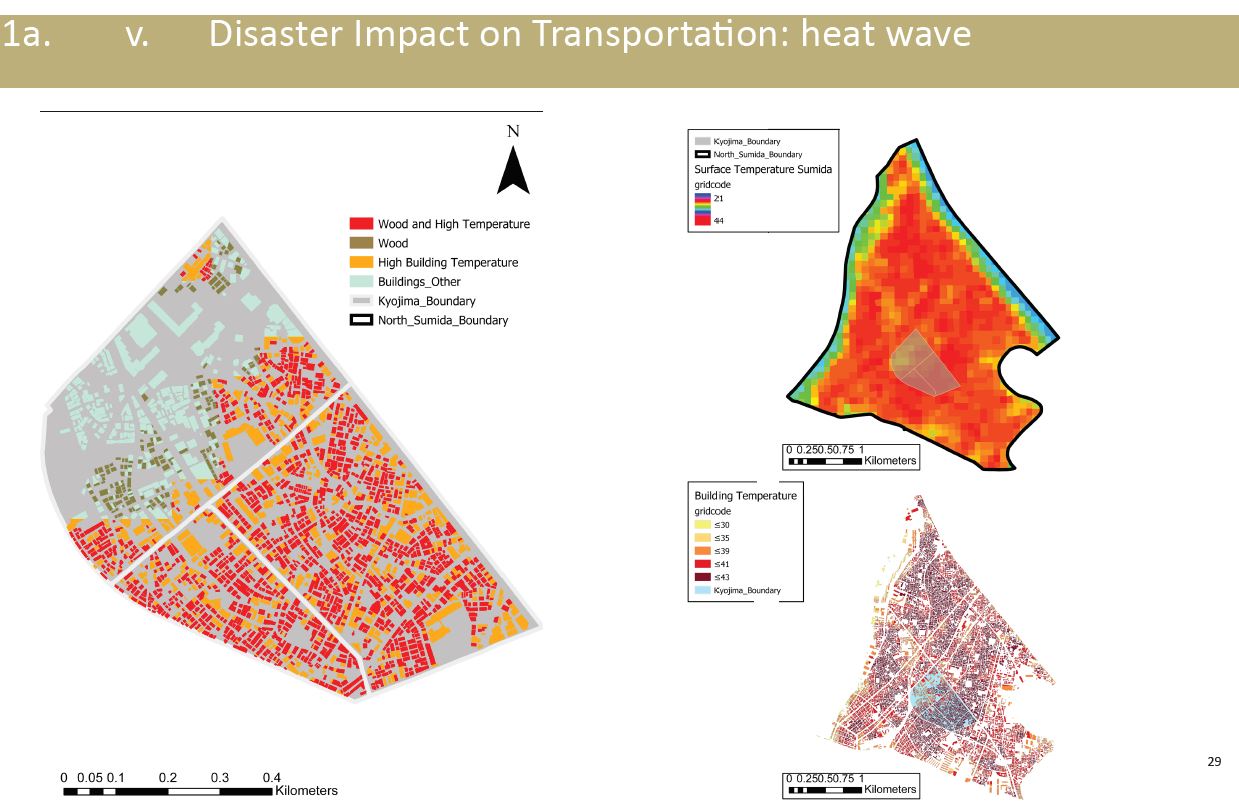
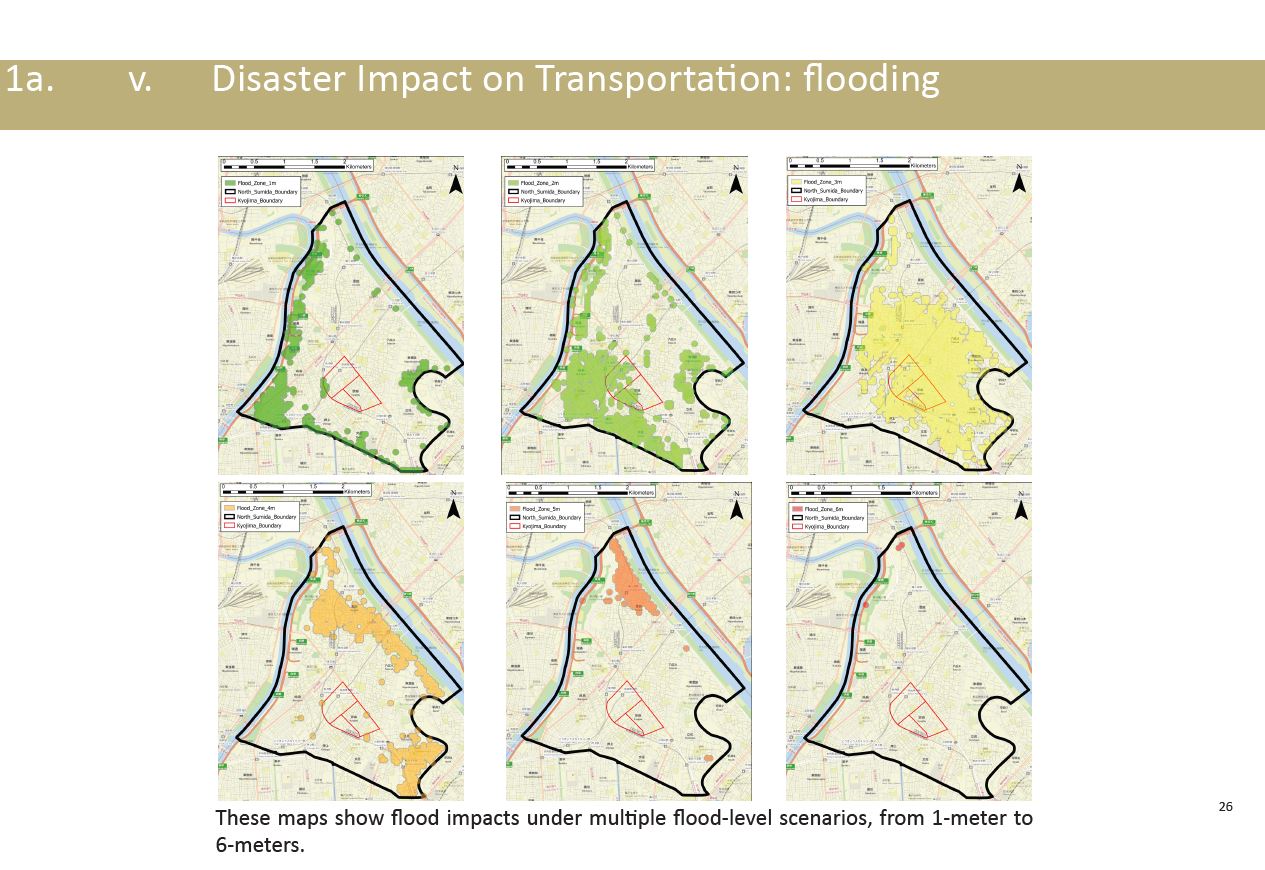
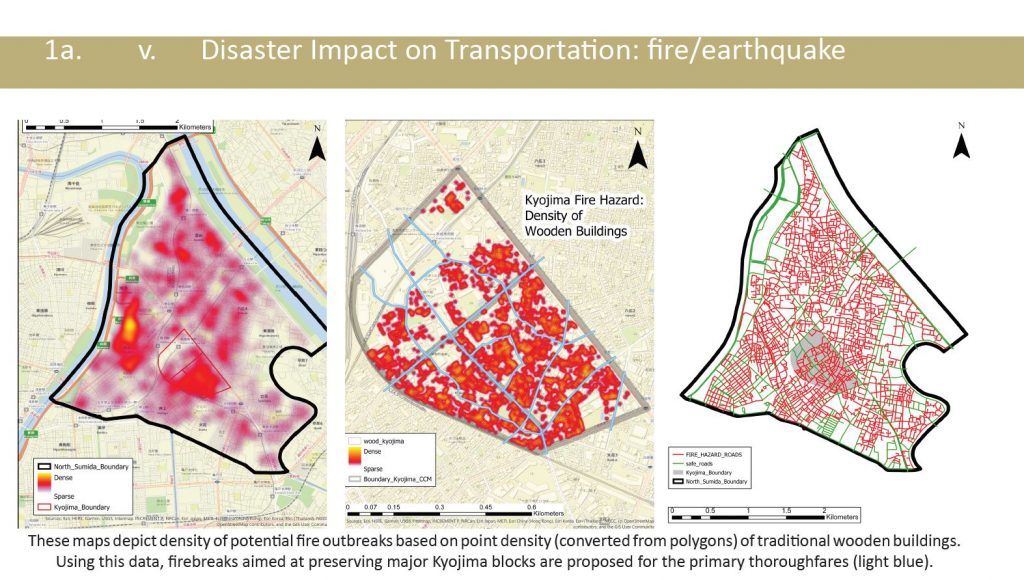
Disaster Impact on Transportation Network
Unlock Insights, Transform Tomorrow!
Dive into the Data with Us – Your Partner in Precision Analytics.
Our Services
Let’s get started